Getting Started
Installation
Start by installing django-postgres-metrics from PyPI:
$ pip install django-postgres-metrics
You will also need to make sure to have psycopg2 or psycopg2-binary
installed which is already a requirement by Django for PostgreSQL support
anyway.
Then you need to add postgres_metrics to your INSTALLED_APPS list. Due
to the way postgres_metrics works, you need to include it before the
admin app:
INSTALLED_APPS = [
    'postgres_metrics.apps.PostgresMetrics',
    'django.contrib.admin',
    'django.contrib.auth',
    'django.contrib.contenttypes',
    'django.contrib.sessions',
    'django.contrib.messages',
    'django.contrib.staticfiles',
]
You also need to make sure that the request context processor is included
in the TEMPLATES setting. It is included by default for projects that were
started on Django 1.8 or later:
TEMPLATES = [
    {
        'BACKEND': 'django.template.backends.django.DjangoTemplates',
        'OPTIONS': {
            'context_processors': [
                ...,
                'django.template.context_processors.request',
                ...,
            ],
        },
    },
]
Lastly, you need to add a URL path to your global urls.py before the
admin URL patterns.
For Django 2.0 and up:
from django.urls import include, path
urlpatterns = [
    path('admin/postgres-metrics/', include('postgres_metrics.urls')),
    path('admin/', admin.site.urls),
]
Congratulations, you made it!
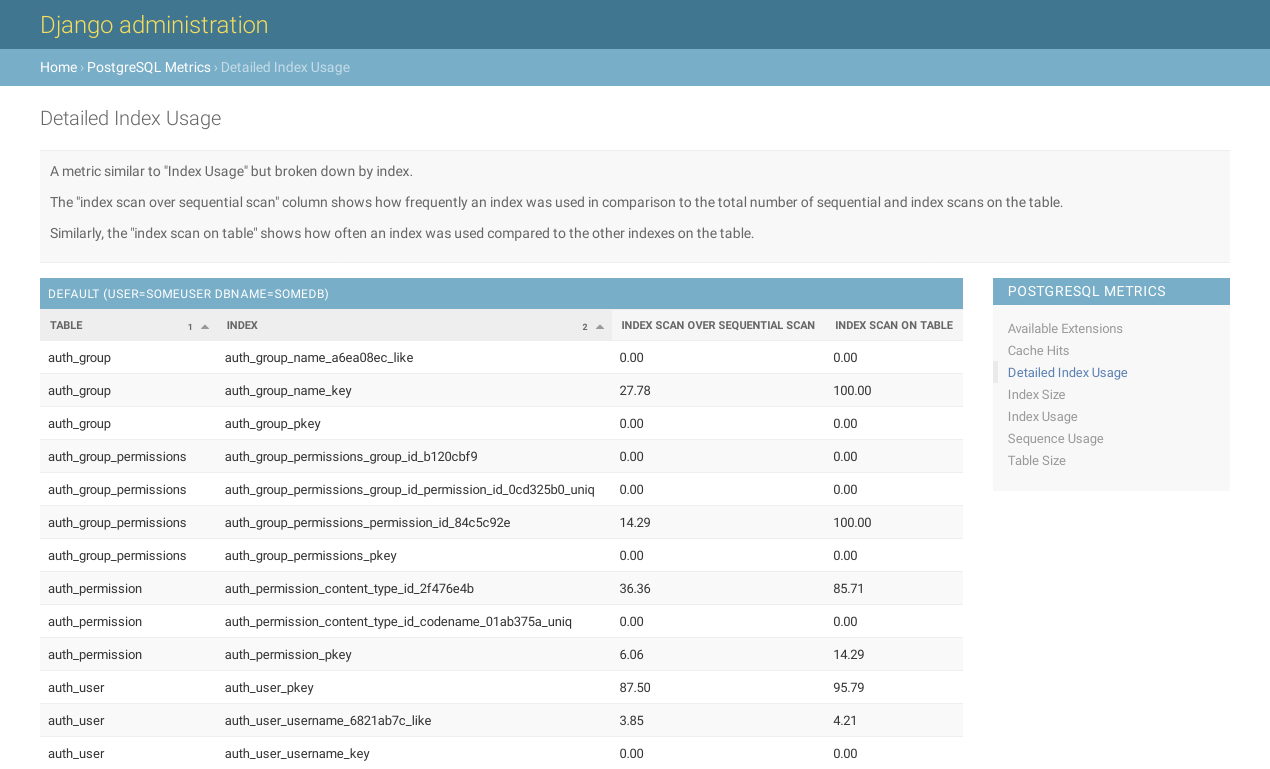
When you now browse to the Django Admin with superuser permissions, you’ll see a “PostgreSQL Metrics” section at the bottom left, listing all available metrics.
This is what a metric could look like:
Designing Your Own Metric
First, you need to import a base class that all metrics inherit from. This will take care of fetching the data from the database, implement sorting if you want, and provide per record and per item in a record styling. Furthermore, you need to make your metric know to django-postgres_metrics-metrics:
from django.utils.translation import ugettext_lazy as _

from postgres_metrics.metrics import Metric, registry


class DjangoMigrationStatistics(Metric):
    """
    Count the number of applied Django migrations per app and sort by
    descending count and ascending app name.
    """
    label - _('Migration Statistics')
    slug - 'django-migration-statistics'
    ordering - '-2.1'
    sql - '''
        SELECT
            app, count(*)
        FROM
            django_migrations
        GROUP BY
            app
        {ORDER_BY}
        ;
    '''


registry.register(DjangoMigrationStatistics)
A short explanation of what the metric class attributes do:
- docstring
This will be shown above the metric’s output and allow you to give an explanation what you see.
- label
This is what you see on the Django Admin index page as a metric name.
- slug
A unique identifier for a metric. This will be used as part of the URL.
- ordering
The default ordering you want to use in the metric. Use column indexes (one-indexed) and prefix with
-for descending sorting.- sql
The actual SQL you want to run. The
{ORDER_BY}part is replaced withORDER BY 2 DESC, 1in the example.
Styling Metric Output
Styling Records
If you want to highlight some of the output rows you can define a
get_record_style method on a metric class:
class MyMetric(Metric):
    ...

    def get_record_style(self, record):
        if record[0]:
            if record[1] > 1000:
                return 'critical'
            if record[1] > 100:
                return 'warning'
            if record[1] == 0:
                return 'info'
            return 'ok'
The record parameter is a tuple with all values of a single row in the
output. This method will be called for every single row being outputted. Don’t
do any expensive calculations here!
django-postgres-metrics ships four pre-defined styles: ok, warning,
critical and info that you can return.
Styling Record Items
Similarly, you can highlight a single value in the metric output by using the
get_record_item_style method on a metric class:
class MyMetric(Metric):
    ...

    def get_record_item_style(self, record, itme, index):
        if index == 2 and record[1]:
            if item > 1000:
                return 'critical'
            if item > 100:
                return 'warning'
            if item == 0:
                return 'info'
            return 'ok'
Along with the record you get the current value or item and the (zero-
indexed) position of the item in the record. The item is provided for
convenience and is defined as item = record[index].