Using django-postgres-metrics
Django Admin Integration
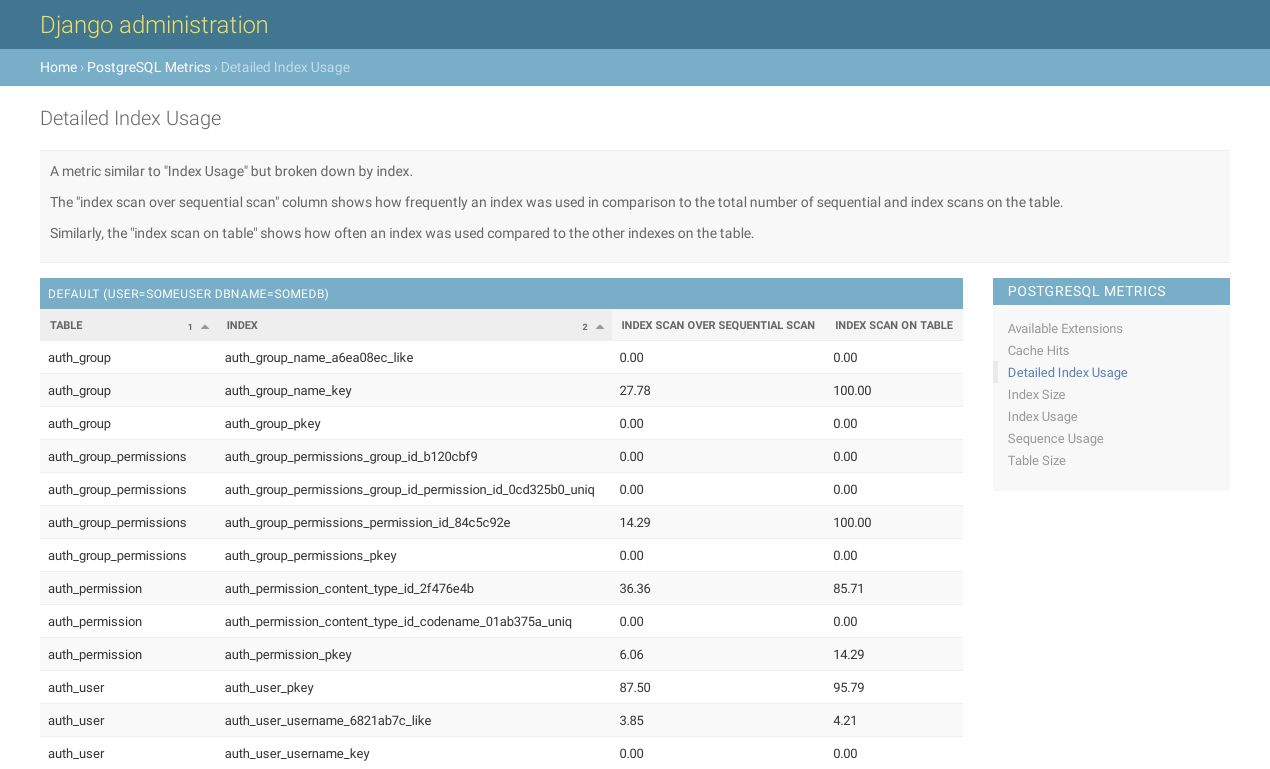
When you now browse to the Django Admin with superuser permissions, you’ll see a “PostgreSQL Metrics” section at the bottom left, listing all available metrics.
This is what a metric could look like:
Command Line Interface
While the Django Admin is often installed and used by many, there are numerous projects that do not use it. For them, django-postgres-metrics 0.13 brings a few management commands that provide the same information.
pgm_list_metrics
This command lists all available metrics.

pgm_show_metric
This command shows the metric’s data. The command expects the slug from the
pgm_list_metrics command output as the first argument.
